Tuesday, November 27, 2018

Haven't post for a very long time

I haven't post any article for 10 year! Looking back the articles that I have written when I was younger and it is funny. I was ambition and full of energy. I was immature but full of hope in life.

Many things have happened in the last 10 years. I got to know more about this world and society. On my journey to become more financial independent, I happened to come across some good and many ugly sides in terms of people. Some people cheat/scam their way to become rich and famous.

Now that I am more mature and more realistic in life. Good thing is that I am still healthy and I am still working hard towards my dream to become financial freedom. I am looking forward to see what will happen within the next 5-10 years. Will I really achieve financial freedom? The only thing I am really sure is that I want to enjoy a better life and do goods to the society. If I want to become financial freedom, I will do it with honesty and integrity. :) All the best to myself!

Thursday, January 1, 2009

Some Basic Technical Analysis Indicators

Happy New year!
This is my first post in this blog of the Year 2009! I am thinking to share some very Basic Technical Analysis indicators and Charting in this entry.

Basically there are 3 types of Chart:-
1. Line Chart
2. Bar Chart
3. Candlestick Chart

I am using GBPJPY (Pound Yen) pair in H1 (1 hour) for all the charts below:-

Line Chart
Line Chart in Forex
- Line chart is the most basic Chart. It only has lines, you can not know clearly about how price moves in each hour in the day.

Bar Chart
Bar Chart in Forex
- Bar Chart presents the information inside a chart Better. How to see?
Bar Chart
Each of the bar in consist of 3 lines, horizontal line on left, horizontal line on right and a vertical line. Each of the Bar is in a certain period. The first Bar Chart that I show is in H1, meaning that each bar is equal to one hour. Horizontal line on the left is named as "Open". Horizontal line of the right is named as "Close". The top of the vertical line is named as "High" and the bottom of the chart is named as "Low". In H1, Chart, eg: 2:00 am. At 2:00:00 am, the opening price of the bar will be the Left horizontal line. In that 1 hour, (from 2:00:00 am to 2:59:59), the price will move up and down, you do not know where will the price move. So, the highest price move on that hour, will the the "High" and the lowest price on that 1 hour will be the "Low". At 2:59:59, the price will determine the "Close".

Candlestick
Candlestick Chart in Forex
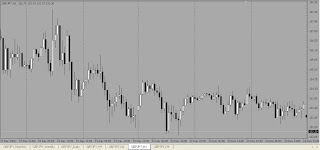
If I am not mistaken, this Candlestick chart is developed by Japanese about 400 years ago to predict the supply and demand of Rice. It is amazing that it is still using until today. Candlestick chart is actually the most popular charting. How to see it? It is almost the same like Bar Chart, but it is easier to see and you will notice if the price is up or down within some distance from the chart.
Candlestick Chart in Forex 2
It is basically consists of 2 types of candle. White and Black (The colour of the candlestick can be customized). The White candle means that on that period, the price is moving up (Bullish), the Black candle means that on that period, the price is moving down (Bearish). I think example above illustrates the Candlestick Chart well.

Technical Analysis
The First Technical Analysis indicator that I would like to share is Bollinger Bands. Bollinger Bands is created by a person name John Bollinger in early 80s. I will not go into details on the Bollinger Bands here.

What is Bollinger Band?
- In simple world, it is a technical analysis indicator that determine if something is oversold or overbought. I will use Forex pair as example.

Bollinger Bands Parameters
Period that we are using is 21 and Deviations is 3. The default for this PFGFX platform is 20 and 2. What is Period and Deviations? Well. I will keep it simple for this post, so, will not discuss here.

Chart without Bollinger Bands (BB)
Forex Chart without Bollinger Bands
- From this chart, you see that like only a random price movement. You can not get much information from the Chart.

Chart with Bollinger Bands (BB)
Chart with Bollinger Bands
After I add Bollinger Bands inside, it shows some information. Bollinger Bands determine if a pair in Forex is Oversold (when the price touches the lower Band) and Overbought (when the price touches the upper Band).

I have highlighted the Oversold and Overbought areas at the below chart:-
Chart with Bollinger Bands Highlighted
However, you must understand that that Bollinger Bands is not a Holy Grail.. It is not 100% accurate. In my opinion, the accuracy of Bollinger Bands is only about 60-70%. So, it is actually acts as support indicator in our SRDC (Support Resistance Daily Candle).
Happy Trading Everyone! May all the Good trades be with you in Year 2009!

Saturday, May 17, 2008

How to marry a guy with $500k annual income

A young and pretty lady posted this on a popular forum:

Title: What should I do to marry a rich guy?

I'm going to be honest of what I'm going to say here. I'm 25 this year. I'm very pretty, have style and good taste. I wish to marry a guy with $500k annual salary or above. You might say that I'm greedy, but an annual salary of $1M is considered only as middle class in New York. My requirement is not high. Is there anyone in this forum who has an income of $500k annual salary? Are you all married? I wanted to ask: what should I do to marry rich persons like you? Among those I've dated, the richest is $250k annual income, and it seems that this is my upper limit. If someone is going to move into high cost residential area on the west of New York City Garden (?), $250k annual income is not enough.

I'm here humbly to ask a few questions:
1) Where do most rich bachelors hang out? (Please list down the names and addresses of bars, restaurant, gym)
2) Which age group should I target?
3) Why most wives of the riches is only average-looking? I've
met a few girls who doesn't have looks and are not interesting, but they are able to marry rich guys
4) How do you decide who can be your wife, and who can only be your girlfriend? (my target now is to get married)

Ms. Pretty


Here's a reply from a Wall Street Financial guy:

Dear Ms. Pretty,

I have read your post with great interest. Guess there are lots of girls out there who have similar questions like yours. Please allow me to analyse your situation as a professional investor. My annual income is more than $500k, which meets your requirement, so I hope everyone believes that I'm not wasting time here. From the standpoint of a business person, it is a bad decision to marry you. The answer is very simple, so let me explain. Put the details aside, what you're trying to do is an exchange of "beauty" and "money": Person A provides beauty, and Person B pays for it, fair and square. However, there's a deadly problem here, your beauty will fade, but my money will not be gone without any good reason. The fact is, my income might increase from year to year, but you can't be prettier year after year. Hence from the viewpoint of economics, I am an appreciation asset, and you are a depreciation asset. It's not just normal depreciation, but exponential depreciation. If that is your only asset, your value will be much worried 10 years later.

By the terms we use in Wall Street, every trading has a position, dating with you is also a "trading position". If the trade value dropped we will sell it and it is not a good idea to keep it for long term - same
goes with the marriage that you wanted. It might be cruel to say this, but in order to make a wiser decision any assets with great depreciation value will be sold or "leased". Anyone with over $500k annual income is not a fool; we would only date you, but will not marry you. I would advice that you forget looking for any clues to marry a rich guy. And by the way, you could make yourself to become a rich person with $500k annual income. This has better chance than finding a rich fool.

Hope this reply helps. If you are interested in "leasing" services, do
contact me…

signed,
J.P. Morgan

Saturday, May 10, 2008

Is the worst really over?

my portfolio on 10 may 2008
Last Week, I sold part of my Apple shares and its options to buy some other Financial stock options and most of my financial stock options are in negative! I bought at the wrong timing. If you ask me, " is the worst really over?" Answer: "I doubt it."
Crude oil price is trading above $125 and AIG missed earnings and lower its guidance. The above trades are only simulation.

Sunday, May 4, 2008

Profit taking from Apple and Call options

I have decided to take some profit from Apple and also the call options to release some buying power to buy other options next week. There are a few options that I am watching: Goldman Sachs (NYSE: GS) Call option, Citigroup (NYSE:C) Call Option, Microsoft (NASDAQ:MSFT) Call Option, Yahoo (NASDAQ:YHOO) Put Option and Bank Of America (NYSE:BAC) Call Option. Research in Motion (NASDAQ: RIMM) is also in my watch list as it has very good momentum comparing with Apple (NASDAQ: AAPL). But what I do not like is RIMM has only a single of line of product - Blackberry while Apple has multiple lines of products - IPhone , IPod, ITunes, Mac and more which make me think that Apple is more attractive.

Profit from Apple on May 2, 2008: 40.77% or $5,240.00
Profit from Apple on May 2, 2008

Profits from Options on May 2, 2008: 101.13 % or $41,210.00
Profits from Options on May 2, 2008
Merck (NYSE:MRK) is doing well, it is just the matter of time for it to trade above $40.

The reasons I choose the Call and Put options stated above.
The Deal between Microsoft and Yahoo is Off! So, that is the reason I have placed order to buy Call Options for Microsoft and Put Options for Yahoo. Goldman Sachs is trading above $200, to me it is a buy opportunity as long as it is trading above $200. If the worst is over, I guess some good fundamental financial Stocks might be attractive. So, I am placing order for Citigroup and Bank of America which have been killed since October, 2007.

Disclaimer: The above trades are not in Real money

Thursday, May 1, 2008

Profits from Apple and Call options on May 1, 2008

Today the USA market was pretty strong. S&P 500 Index was able to close above the Major support of 1400. Last time 500 Index closed above 1400 was on 10 January. I believe that market will trading above this level for some time and will continue to go higher. I guess "The Worst is Over!" is sticking in the minds of the majority investors.S&P 500 index closed above 1400 level

Apple has broken through the resistance at $175 and 180. Well, it is not unusual as the market was so strong, DOW was up 1.48% and NASDAQ was up 2.81%. Any strong NASDAQ stocks could easier up 3% today, Google was up 3.27%, Research in Motion was up 5.24% and Apple was up 3.48%.

The below is my profit from Apple shares: 40.03% or $5,146.00
Profit from Apple Share on May 1, 2008
Now, I will take half of the profit if it is trading below $175 and let the other half goes.

My profit from options: 92.18 % or $37,565.00
my options on May 1, 2008 I just bought 2 new call options which the mother share is MERCK (NYSE:MRK). Merck is a Drug company. I bought the call options because Merck was recommended by Jim Cramer. As per Jim Cramer, Merck has better growth than Pfizer(NYSE:PZE), although both companies are Dow Components. I see the Daily chart for Merck, its share price is trading at half of what it was on January. It was getting killed and it sounds like another Apple or Google. The investors were just over react for the last couple of months. It is a steal at this price!
Chart of Merck (NYSE:MRK)

Now the market is getting stronger and I think that it is the buy opportunity for the stocks which have good fundamental but were killed because of the over reactions from investors and may be because of the fear of the Recession.

Tuesday, April 29, 2008

I have paper Profit of more than $30k from Apple and Apple Call Options!

Apple (AAPL) close price on April 29, 2008

Apple was up $5 in 2 days and I have paper profit of more than $30k! This is amazing! I guess Apple will stay above $170 for a while. I will not take any chance, if Apple comes down below $170, I will take half of the profit. I might put a sell stop at $169.90 for 50% of my Apple shares.

Profit from Apple Mother shares: 36.18% or $4651.00
Apple Profit on April 29, 2008

Total Profit from Apple Call Options: 156.47% or $29,025.00
Profits from Apple Options on April 29, 2008

Apple is trading comfortably above Support of $170 right now. It will stay at the price level as long as there is no bad news from the company or any so-called analysts downgrade the stock with stupid reasons. In my opinion, it will trading upward all the way to $200 again before the end of this year. Let's see if I am right.

Well again, I really hope that the above trades are in real money.

Sunday, April 27, 2008

Profit from Apple Call Options, Look at That!

Profit from Apple Call Options
I have bought Apple Call Options when Apple was almost at the Bottom. At one time, I was losing more than $10k and now I have paper profit of $22k! With this money, I can buy a few IPhones and also may be change my current Dell Laptop to a MacBook Air! I also have bought 100 Apple Mother shares at the $128.54 an Now I have paper profit of $4,119.
Apple (AAPL) $4k Profits
I think that Apple could go higher. I will feel comfortable as long as it is trading above $160 and $150. If it is really come down below $160, I think I might take half of the profit and let the other half goes. Now, the resistance is at $170, I hope next week it could break it convincingly.

How I wish that the above trades are real money. :-)

Tuesday, April 22, 2008

Tips for procrastinators: How to be punctual for work or school

Are you always late for work or school? Are you always set your alarm 30 minutes earlier for yourself to have time to clean up yourself, but you hit the snooze button so that you continue sleep another 15 minutes. Next,it turns out that you have to rush to clean up yourself and late for work/school. I bet you come to the right place. I rarely late for work/school as a result of a thing that I do to make myself punctual - "Set all my clocks to be running on a future time"

I have this weird habit since high school to make myself to be punctual for any events. The time of my clock and watch during high school was 30 minutes ahead of the actual time. About 2 years back when I was still in University, I set the time of my clock and watch an hour faster. So, I always be the first one who arrived at the lecture hall. Sometime when I reached the lecture hall and I saw no body was inside, I would have confused myself that I saw the wrong time table. After I called my friends for time table, then only I realized that the time of my watch was an hour faster. Usually, I used the EXTRA time to do self study inside the empty lecture hall.

However, this technique will only be useful if you are able to make yourself forget that you set your time ahead of the actual time. It will not be useful if you set time of your clock 30 minutes faster but you hit the snooze button and continue to sleep for another 45 minutes. This is normal and it happened to me during university when I got used to the time I set and my mind would auto-deduct an hour from the current time and I became late for my classes. But after a short while, I found a remedy for this problem - "Make myself not to get used to the time that I set". Once a while, I will set my clocks back to normal time and then I will set the time ahead after one or two weeks. With this way, I will not get used with the advance time that I set on my clock or watch.

Steps of this technique:-
1. Set all your clocks time to a future time (all depends on how much time you need to continue procrastinate, FYI, now I am 20 minutes ahead of the actual time)
2. Set all your clocks time back to normal time after about a month
2. Set all your clocks time to a future time again.

I have been practicing this for years and it works well for me. Try it out yourself and let me know if this works for you.

Sunday, April 20, 2008

Google Blows past Estimates, Apple above 160 support

For the past few months, Google (NASDAQ:GOOG) has been hammered resulting from the rumors of its decreasing click-through rates and its market share might be grabbed back by YAHOO! (NASDAQ: YHOO) and it was further fueled by some so-called analysts to downgrade the stock which continued the burning of the stock. Google has reported its first 1Q earnings of 2008 on last Thursday after market close which blew past estimates and the stock was eventually up 20% on Friday!
Google (NASDAQ:GOOG)Blows past Estimates
Google(NASDAQ:GOOG) downgrades on 1Q 2008

Another stock which has been hammered by so-call Analysts was APPLE (NASDAQ:AAPL) for the rumors of less revenue resulting from unlocked IPhone and the saturation of the IPod market. Apple share was comfortably closed above support of 160 on Friday, thanks for the Google Earnings. Apple will release its earnings on next Wednesday (23 April 2008) after market close and I am waiting Apple to prove that those so-called Analysts wrong again.
Apple (NASDAQ:AAPL) closes above 160 on April 19, 2008
Apple (NASDAQ:AAPL) chart on April 19, 2008

It is surely an exciting week ahead.